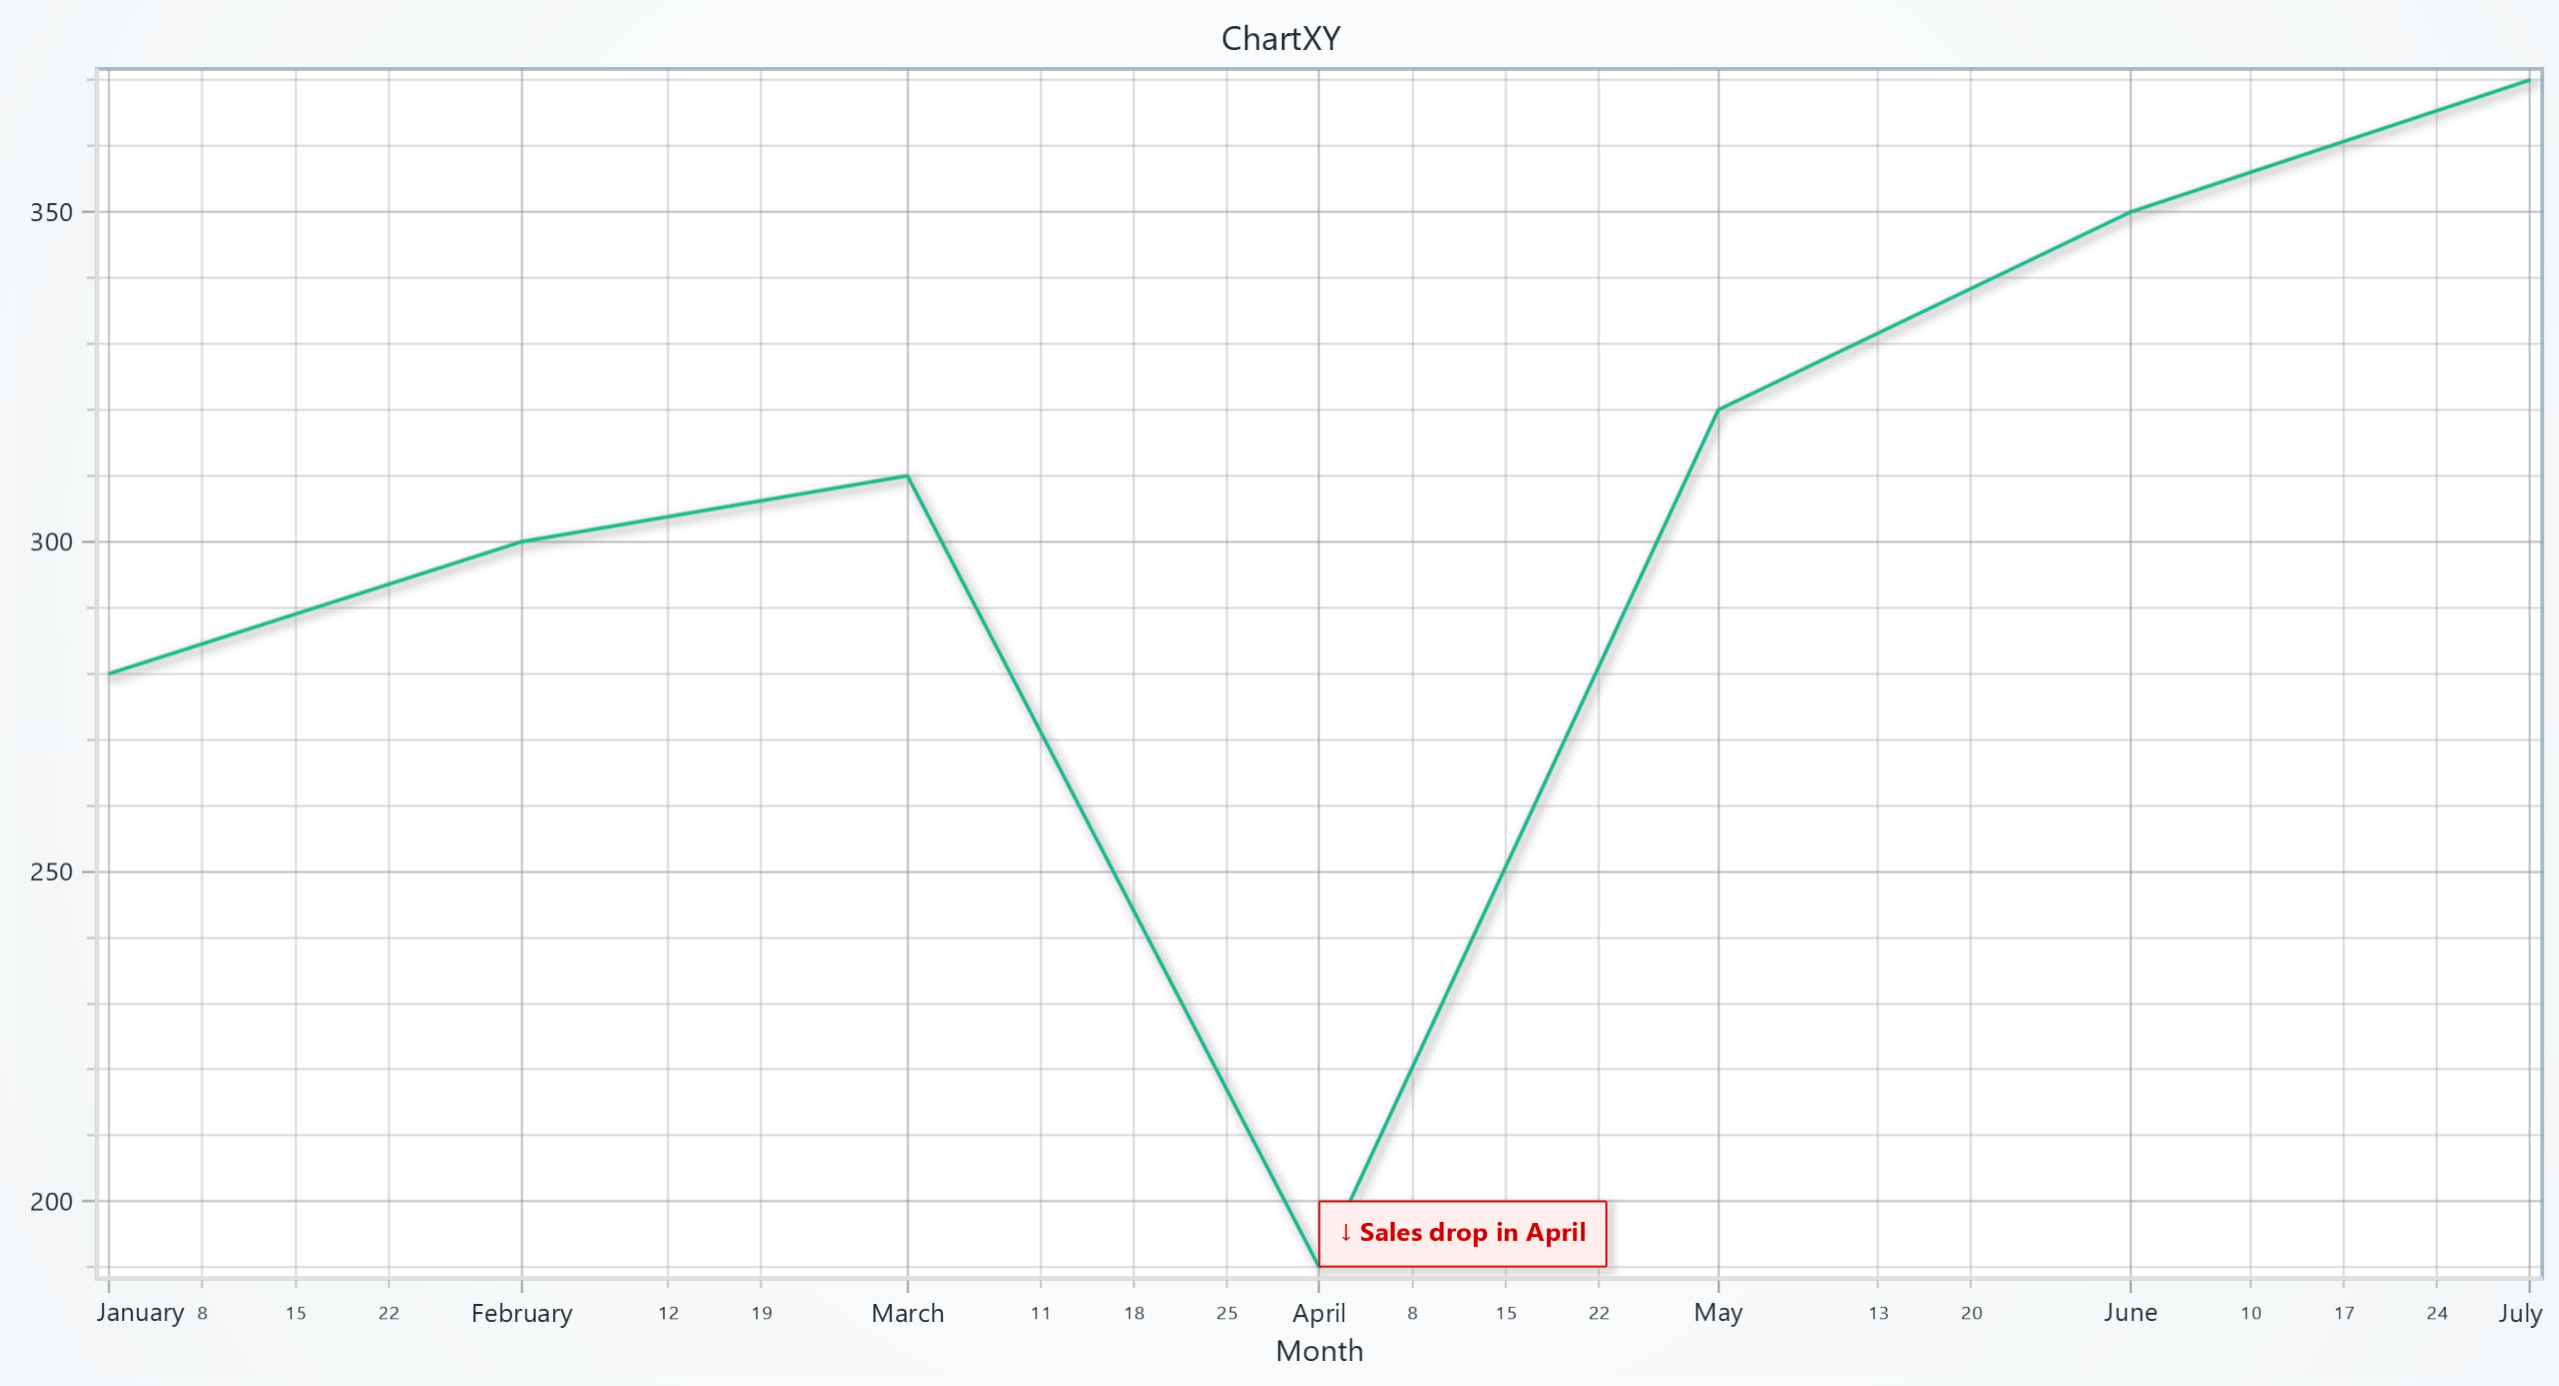
TextBox
TextBox is a UI element for adding annotations on top of charts. It supports text, images, videos, styling, and precise positioning.
Adding TextBox
import lightningchart as lc

chart = lc.ChartXY()
textbox = chart.add_textbox("Hello!", x=60, y=30)
Setting the Text
Set or update the content displayed inside the TextBox.
textbox.set_text("Updated annotation")
Padding
Define space between text and the border of the TextBox.
textbox.set_padding(10)
textbox.set_padding(left=8, top=6, right=8, bottom=6)
Text Fill Color
Change the text color inside the TextBox.
textbox.set_text_fill_style('#ff0000')
Text Font Style
Set font size, family, weight, and style.
textbox.set_text_font(
    size=16,
    family='Arial',
    weight='bold',
    style='italic'
)
Rotate Text
Rotate the text content inside the box.
textbox.set_text_rotation(45)
Background Color
Set the background fill color of the TextBox.
textbox.set_background_color('#ffffff')
Stroke Style
Configure the border (stroke) of the text box.
textbox.set_stroke(thickness=2, color='#cccccc')
Add Background Video
Use a video file or URL as the background.
textbox.add_video("path/to/video.mp4", fit_mode="Stretch")
textbox.add_video("https://example.com/video.mp4")
Add Background Image
Use an image as the fill for the TextBox.
textbox.add_image("https://example.com/image.png", fit_mode="Fit")
Theme Effect
Toggle visual effects like drop shadows or glows.
textbox.set_effect(True)
Positioning
Set the TextBox to a specific chart coordinate.
textbox.set_position(50, 80)
textbox.set_origin('CenterTop')
Margin
Set external space around the box.
textbox.set_margin(8)
textbox.set_margin(left=4, right=4, top=2, bottom=2)
Drag Mode
Allow or restrict dragging behavior.
textbox.set_dragging_mode('draggable')
Auto Dispose
Automatically dispose the TextBox when it exceeds a viewport size threshold.
# Auto-dispose when TextBox exceeds 20% of viewport width
textbox.set_auto_dispose(mode="max-width", threshold=0.2)
Options include:
max-widthmin-width
Dragging Modes
Set how the TextBox can be dragged within the chart area.
textbox.set_dragging_mode('draggable')
Options include:
draggablenotDraggableonlyHorizontalonlyVertical
Pointable TextBox
For interactive callouts that include a pointer/arrow, use the Pointable builder:
pointable = chart.add_pointable_textbox("Threshold", x=20, y=40)
pointable.set_direction('down')
pointable.set_pointer_length(25)
pointable.set_tick_label_padding(8)
PointableTextBox inherits every TextBox method (text, padding, images, effects, drag mode, etc.) and adds pointable‑specific helpers:
set_direction()/get_direction()— control the pointer direction (Up/Right/Down/Left).set_pointer_length()/get_pointer_length()— adjust the pointer head/stem length in pixels.set_tick_label_padding()/get_tick_label_padding()— spacing between pointer and label text.